Hi @staff a quick question:
Is given in some course here that provides a detailed class about how to use rosbags and rqt plots? I know to use in general, however I wish more examples, know how to get an interval of rqt plots, windowing it and save to png/jpeg/etc image. The same for rosbag if is there options to record from specific time, between two Time_stamps…etc
I need to improve my skills on that in order to do a Benchmark after extract, save and further plot ros topics data.
Actually I am interested for example:
1 - record the odom topic and velocity topic
2 - Have “external” access to it, in order to have these data stored in a list, csv or other format
3 - Import these data and plot, using matplotlib library for example.
Would be possible? I do not know which format the rosbag store the data and if is it possible to export, or even if there are ROS app to plot these data from a ROSbag ??
I am not sure if this would be doing the task twice (redundant–uselles effort?), because RQT also seems to plot the data on real time. However does RQT store/save this data in somewhere? Does the steps I have written previously make sense?
Which would be the best way to get these skills quickly, going to some video-class produced here or looking for this on ROS-wiki?
If you have something in this regard already available , please let me know in which course they are to access.
Thanks!
Hi,
The only course that mentions rosbags is the Ros Basics in Five days, the debugging chapter.
I would record all the data in a rosbag, thats the simples way of doing it
Using Rqt_plot is the way to go. Rememebr also that you can aslo execute RVIZ and represent more complex stuff there.
Wiki ROSBAG
Yes @duckfrost Using Rosbag is quite good to store multiple and simultaneously topics info!!!
I have recorded a video from this attempt if someone be interested on it:
I have done by 2 steps:
1 - Record all the data( multiple topics) in the same bag I wish to use, example:
$ rosbag record --duration=1m -O odom_vel.bag /odom /estimate_vel_kmph /vehicle_status
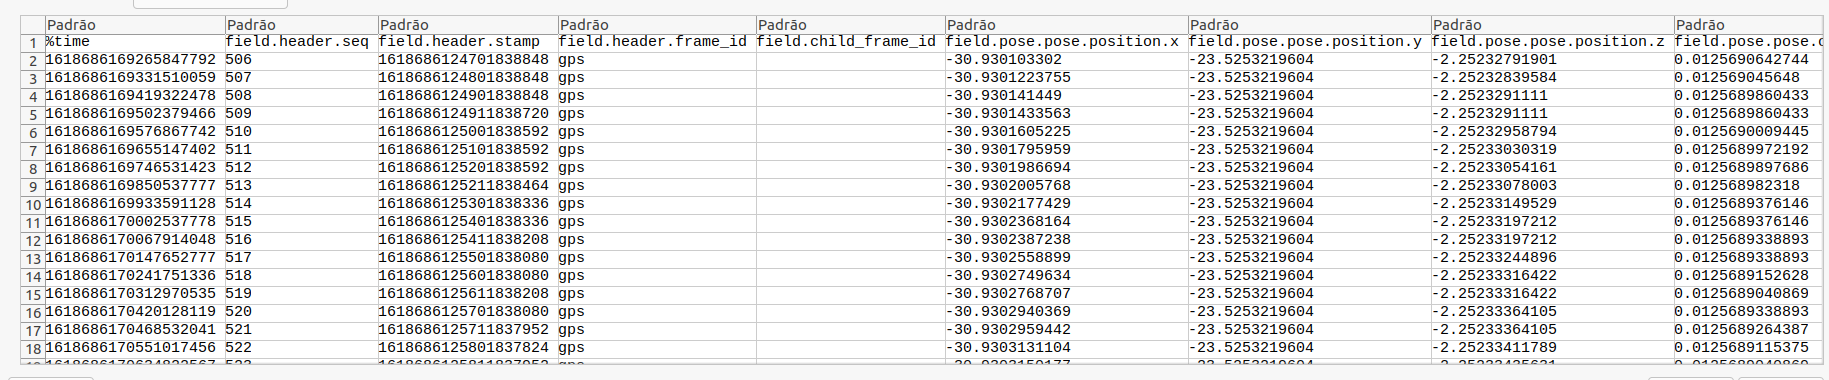
2- Convert each data from the rosbag separately, to a .csv file:
$ rostopic echo -b odom_vel.bag -p /odom > odomtery_data.csv
$ rostopic echo -b odom_vel.bag -p /estimate_vel_kmph > velocity_data.csv
$rostopic echo -b odom_vel.bag -p /vehicle_status > status_vehicle.csv
However the amount of data extracted in just 1 minute are ENORMOUS! I mean I believe it the rosbag gets data every milisecond. If you take a look into the csv file the lines that correspond to position etc never ends (from odometry):
I counted about 1000 lines. To plot this on Matplotlib or other app, I believe I am going to have a huge Headache!
That’s why I would like to use the RQT to plot the data regarding 1 minute trip for example, with less discrete points from Odometry.
However When I used RQT, it seems it works just online, while the car is moving it displays the topic data graphically. And to save these plots in the moment of the trip the user wishes. Let’s say the car simulation trip delays 10 minutes. And I wish to plot the data using RQT just in interval of minute 3 and minute 4. Is it possible to get this plot from RQT?
Your comment about RVIZ. I did not understand…it is useful to visualize the data. But Rviz has some framework to plot data also?
Does the academy offer more advanced course about RQT and these Rviz plots (if exist) ?