The nodes in NAV2 are very fragile. Take the controller server as an example. If I use the debugger to pause it, it exists automatically. That means breakpoints will also cause the controller server exits.
I have tried to set the parameter bond_timeout of the lifecycle_manager to zero or a big number, but the controller server node still exists automatically.
Hi @bluebird, I know that nodes are notoriously hard to work with if you are using the debugging. My guess is that the lifecycle manager detects the controller has been stopped and it stops it.
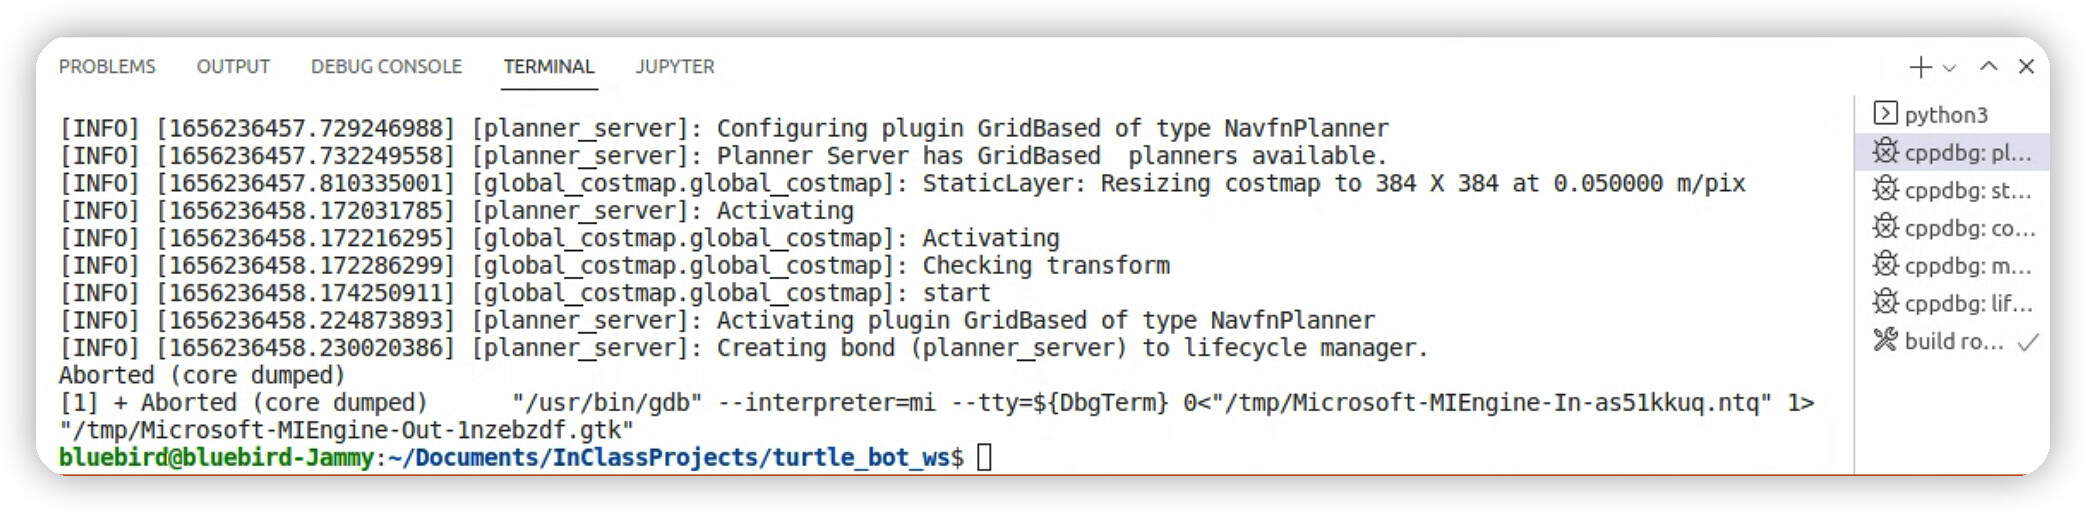
I see a core dumped message in your output, do you see any other that could give you clues from the manager or the controller?
And my last question, how is this related to debugging a cost map? The best thing is to just make the changes you need for the costmap, compile and relaunch to see the changes. Cumbersome but I don’t know of a more effective way.
I agree with you. The nodes that are managed by the lifecycle manager have their heartbeat signals. The debugger pauses a node and also pauses the signal. I have tried to set the parameter bond_timeout of the lifecycle_manager to zero or a big number; however, it seems to have no effect.
I have followed the tutorial to build a cost map plugin, and I also read the raw code of the static layer. Since I can not debug a cost map, I make an empty file called a homemade static layer. Then, paste the raw code from the official version into it line by line. I would like to say that the writer is well thought out and has excellent skills.