Hello @leonar29 ,
Use this script:
import warnings
warnings.filterwarnings('ignore')
import matplotlib
import matplotlib.pyplot as plt
from matplotlib import cm
from mpl_toolkits.mplot3d import Axes3D
import numpy as np
import pandas as pd
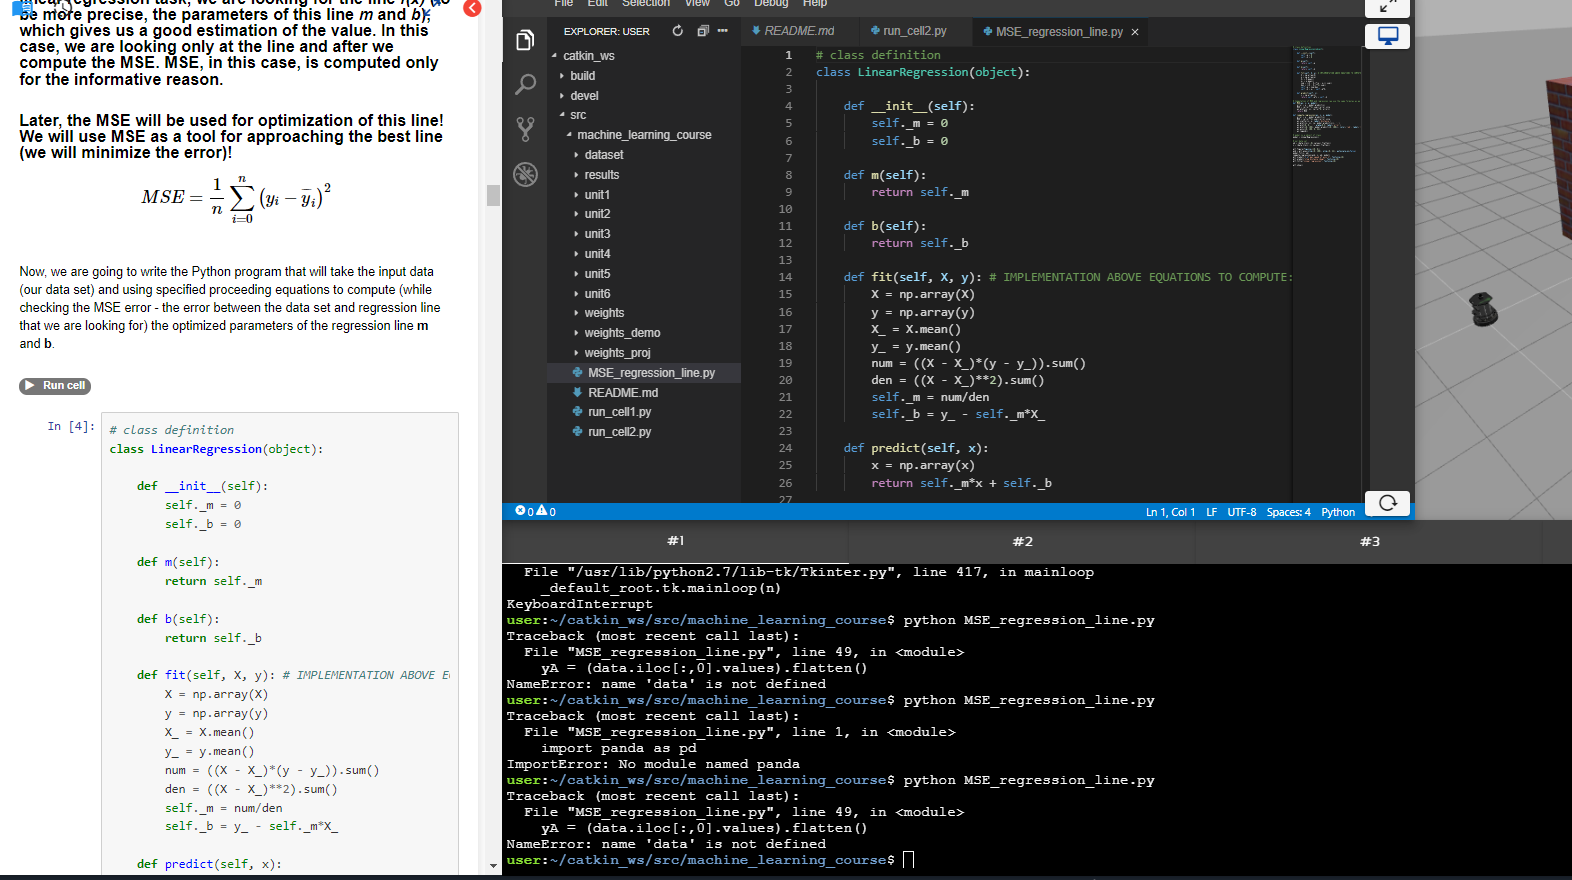
# class definition
class LinearRegression(object):
def __init__(self):
self._m = 0
self._b = 0
def m(self):
return self._m
def b(self):
return self._b
def fit(self, X, y): # IMPLEMENTATION ABOVE EQUATIONS TO COMPUTE: m, b
X = np.array(X)
y = np.array(y)
X_ = X.mean()
y_ = y.mean()
num = ((X - X_)*(y - y_)).sum()
den = ((X - X_)**2).sum()
self._m = num/den
self._b = y_ - self._m*X_
def predict(self, x):
x = np.array(x)
return self._m*x + self._b
# Computation of MSE and regression (we use the same formulas as we defined earlier)
def MSE(ax, x, y, model):
error = y - model.predict(x)
MSE = (error**2).sum()/error.size
ax.plot([x, x], [error*0, error])
return MSE
def compute_regression(ax, x, y, model):
error = y - model.predict(x)
MSE = (error**2).sum()/error.size
ax.scatter(x, y, label='distance')
ax.plot([x, x], [y, model.predict(x)], ':')
ax.plot(0, 0, ':', alpha=0.5, label='error')
ax.plot([0, 100], model.predict([0, 100]), color='red', label='regression')
ax.axis([0, 100, 0, 22])
ax.legend()
# model is a object of class
model = LinearRegression()
# load dataset
data = pd.read_csv('/home/user/catkin_ws/src/machine_learning_course/dataset/test_brakes.csv')
# remove Unmaned column
data.drop(['Unnamed: 0'], axis=1, inplace=True)
# our data set
yA = (data.iloc[:,0].values).flatten()
x = (data.iloc[:,1].values).flatten()
plt.figure(figsize=(10, 8))
axA = plt.axes(xlim=(0, 100), ylim=(0, 22), autoscale_on=False)
model.fit(x, yA)
compute_regression(axA, x, yA, model)
plt.xlabel("% of max speed of axis 1", fontsize=16)
plt.ylabel("stop distance [deg]", fontsize=16)
plt.title("Linear regression", fontsize=18)
plt.show()
I’m going to update this course to adapt all the codes so that they can be run as scripts.